About this ebook
Price tells you where to look. Time tells you when to look. Structure tells you what to look for. Price behavior determines whether the idea survives.
Most trading education is dominated by price. Traders draw support and resistance, mark highs and lows, identify gaps and blocks, and then search the chart for a reaction. Time often appears only as a session label or a clock in the corner.
This book asks a different question:
What changes when time is treated as a coordinate rather than merely a timestamp?
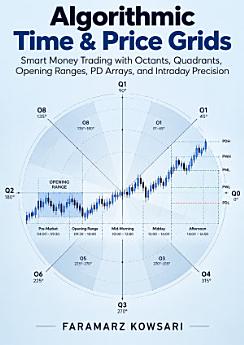
The result is a practical framework for studying the intersection of measured price ranges, defined time windows, Smart Money Concepts, PD Arrays, Opening Ranges, Quadrants, Octants, Fair Value Gaps, Consequent Encroachment, macro windows, and intraday execution.
This is not a book about blindly collecting chart patterns.
It is about building a time–price coordinate system in which every level, range, setup, and entry idea must answer four questions:
Where is price?
When is the market there?
What structure is present?
What would invalidate the idea?
The central framework is deliberately conditional. Instead of asking the reader to accept claims about hidden market algorithms on faith, the book converts those claims into observations that can be measured, mapped, challenged, invalidated, and tested. Algorithmic_Time_and_Price_Grid…
FROM HORIZONTAL LEVELS TO A TWO-DIMENSIONAL MARKET MAP
A horizontal price level is incomplete without context.
The same price may carry very different meaning during pre-market trading, the Regular Trading Hours open, a macro window, the lunch period, or the afternoon session.
Algorithmic Time & Price Grids therefore develops a framework in which price location and time location are studied together.
You will learn how to construct a measured range first, establish its internal subdivisions, place it inside the relevant session or time window, and only then evaluate the behavior occurring at the intersection.
The goal is not to make the chart look precise after the move has happened.
The goal is to create rules that can be stated before the outcome is known.
QUADRANTS: TURNING A RANGE INTO FUNCTIONAL TERRITORY
A defined high–low range can be divided into quarters to create a more disciplined language for:
Equilibrium
Premium
Discount
Internal range location
Q1–Q4 territory
Nested range analysis
The book shows how quadrants can organize location without pretending that a quadrant itself is a trading signal.
A mathematically exact level is useful only when the range that created it is defensible.
The guiding principle is simple:
Quadrants describe territory. They do not issue orders.
The book explicitly treats premium and discount as spatial descriptions rather than automatic long or short signals. Algorithmic_Time_and_Price_Grid…
OCTANTS: GREATER RESOLUTION WITHOUT FALSE PRECISION
The framework then divides the same range into eight equal 12.5% intervals.
Octants allow traders to study finer internal positioning while confronting one of the most dangerous problems in technical analysis:
False precision.
More lines do not automatically create more information.
More subdivisions do not automatically create a more predictive model.
The book teaches readers to distinguish between genuinely useful spatial resolution and a chart that merely looks sophisticated because it contains more calculated levels.
An octant is defined here as one of eight equal subdivisions of a specified range, each representing 12.5% of that range. Algorithmic_Time_and_Price_Grid…
OPENING PRICES, OPENING RANGE GAPS, AND MEASURED EXPANSION
Opening prices often form some of the most important coordinates of an intraday session.
The book examines:
Regular Trading Hours Open
Prior settlement and close references
Opening Range Gaps
Measured range-unit projections
Premium and Discount relative to an opening structure
Session handoffs
Opening-price anchoring
Instead of treating an opening range as a decorative box on a chart, the reader learns to define exactly which prices created the range, when it became valid, what subsequent behavior supports the interpretation, and what invalidates it.
The book defines the Opening Range Gap using a stated convention between a prior settlement/close reference and the Regular Trading Hours opening price rather than leaving the term ambiguous. Algorithmic_Time_and_Price_Grid…
THE TIME AXIS: WHEN THE MARKET MATTERS
Price is only half of the grid.
A major section of the book is devoted to the time axis.
Topics include:
New York local time
Daylight Saving Time considerations
Regular Trading Hours
Top-of-hour behavior
Macro windows
Morning delivery
Second-hour delivery
Lunch reversals
Temporal handoffs
Nested daily, session, and hourly time grids
Rather than treating a named time window as a guaranteed turning point, the framework uses time as a filter for deciding when a particular structural hypothesis deserves attention.
The glossary explicitly defines a Macro Window as a temporal organizing device rather than a guaranteed reversal point. Algorithmic_Time_and_Price_Grid…
PD ARRAYS INSIDE THE GRID
A chart pattern alone is not enough.
The same Fair Value Gap, Order Block, Breaker, or imbalance may have very different analytical value depending on where it forms inside the larger time–price coordinate system.
The book develops location-dependent analysis of:
Fair Value Gaps (FVGs)
Inversion Fair Value Gaps (IFVGs)
Order Blocks
Breakers
Suspension Blocks
Consequent Encroachment
Wick logic
Opening-price structures
Higher-time-frame control areas
First Utilization
Body versus wick behavior
The reader learns to ask not merely:
“Is there an FVG?”
but:
“Where did it form, when did it form, what range contains it, how is price interacting with it, and what behavior would invalidate its significance?”
This distinction is fundamental to the book.
CONSEQUENT ENCROACHMENT AND MIDPOINT LOGIC
Consequent Encroachment is treated with numerical discipline rather than mysticism.
Within the framework, CE is the 50% midpoint of a defined interval, such as a Fair Value Gap or wick.
Its arithmetic is simple.
Its usefulness depends entirely on context. Algorithmic_Time_and_Price_Grid…
The book examines how midpoint logic interacts with:
Wick penetration
Body acceptance
Rejection
Progressive wicks
Range geometry
Price delivery
This transforms CE from another horizontal line into a measured component of the wider time–price model.
FROM HIGHER-TIME-FRAME NARRATIVE TO ONE-MINUTE EXECUTION
The later chapters move from mapping to execution.
The reader learns how to connect:
Higher-time-frame directional context
to
Defined price ranges
to
Time windows
to
PD Arrays
to
Lower-time-frame confirmation
to
Entry
to
Invalidation
to
Position sizing
The book includes a dedicated Time–Price Intersection Entry Model and explores what happens after a macro window through residual delivery and structural continuation. Its later chapters also address low-resistance runs, structural failure, sizing, retests and stale setups. Algorithmic_Time_and_Price_Grid…
INVALIDATION, RISK, AND THE DANGER OF FALSE CONFIDENCE
One of the defining ideas of this book is that an analytical framework becomes meaningful only when it can fail.
Every major setup is therefore examined together with its failure conditions.
The reader is repeatedly asked to separate:
Context
Measurement
Time
Structure
Validation
Risk
A broken thesis is not repaired simply by adding another indicator, another PD Array, another line, or another piece of “confluence.”
This is particularly important in leveraged and short-term trading, where analytical confidence and actual financial risk are not the same thing.
The book explicitly covers:
Structural invalidation
Temporal invalidation
Position sizing
Leverage
Overfitting
Execution friction
False precision
FROM THEORY TO EVIDENCE
The final part of the book takes an unusually important step:
It asks the reader to test the framework instead of believing it.
A visual framework becomes researchable only when discretionary terms are operationalized, examples are selected prospectively, and outcomes are measured beyond simple win rate. Algorithmic_Time_and_Price_Grid…
The testing section introduces concepts such as:
Sample design
In-sample and out-of-sample evaluation
Expectancy
MAE
MFE
R-multiples
Costs
Biases
Curve fitting
Failed observations are not to be discarded. The book explicitly recommends writing measurable rules, testing a fixed sample, recording every eligible occurrence, and preserving failed cases. Algorithmic_Time_and_Price_Grid…
That changes the framework from an attractive chart narrative into something that can actually be examined.
BUILD A REPEATABLE TIME–PRICE PLAYBOOK
The final operational goal is not to add more variables.
It is to remove unnecessary choices.
A usable trading playbook is reduced to:
One defined market
One session
One range convention
A limited set of relevant arrays
Explicit invalidation
A journal
A review process
Controlled change
The book recommends freezing the playbook for a defined sample, reviewing it only after the sample is complete, and changing one variable at a time. Algorithmic_Time_and_Price_Grid… Algorithmic_Time_and_Price_Grid…
A VISUAL TRADING BOOK BUILT FOR FAST UNDERSTANDING
This is not a text-only trading manual.
The book contains calculated technical charts, time–price diagrams, decision maps, synthetic OHLC reconstructions, range subdivisions, session markers, and explanatory visual structures.
The technical figures deliberately distinguish instructional reconstruction from historical evidence. The book notes that synthetic charts are useful for isolating geometry but should never be mistaken for evidence of universal market predictability. Algorithmic_Time_and_Price_Grid…
The book concludes with a special:
Visual Trading Atlas: 10 Essential Maps for Time, Price & Intraday Precision
These ten standalone visual guides reorganize the major concepts into mobile-friendly infographics covering:
Time–Price Grids
Session Timing
Opening Ranges
Equilibrium
Consequent Encroachment
Quadrants
Octants
PD Arrays
Confluence
Intraday Bias
Entry, Invalidation, Targets, Risk and Review
The atlas is designed both as a quick-reference companion and as a visual recap of the complete framework. Algorithmic_Time_and_Price_Grid…
PRACTICAL APPENDICES
The book also includes:
Glossary of Time–Price Grid Terminology
Quadrant, Octant, and Opening-Range Projection Calculations
Pre-Market Mapping Checklist
Intraday Execution Checklist
Post-Trade Review Sheet
References and Source Notes
These tools are designed to help convert theoretical understanding into a repeatable analytical workflow. Algorithmic_Time_and_Price_Grid…
WHO THIS BOOK IS FOR
Algorithmic Time & Price Grids is designed for:
• Smart Money Concepts traders
• ICT methodology students
• Futures and index traders
• Intraday traders
• Price-action traders
• Traders studying Opening Range behavior
• Traders interested in Fair Value Gaps and PD Arrays
• Traders trying to integrate time with price structure
• Readers who want to understand Quadrants and Octants mathematically
• Traders building rule-based discretionary playbooks
• Readers interested in testing trading ideas rather than accepting chart narratives on faith
The book's central discipline can be summarized in one sentence:
Time defines when to look. The measured range defines where to look. The PD Array defines what to look for. Price behavior determines whether the hypothesis survives. Algorithmic_Time_and_Price_Grid…
Algorithmic Time & Price Grids is not about adding more lines to a chart.
It is about making every line earn its place.
Discover more
About the author
Faramarz Kowsari is an author and researcher based in Istanbul. Focusing on the intersection of technology, education, and personal growth, he has published over 80 digital titles on international platforms.
His areas of expertise span Artificial Intelligence, prompt engineering, modern trading strategies (Smart Money Concepts & algorithmic trading), as well as classical literature and mindfulness.
In addition to writing, he develops web-based educational tools and creates specialized instructional video content.
Official Profiles & Repositories
Official Website:
https://FaramarzKowsari.
Books Intro Page:
https://FaramarzKowsari.
Google Play Books:
https://play.viewpro.live/store/
LinkedIn:
https://www.linkedin.com/in/